
Introduction
The COVID-19 pandemic has affected Pennsylvania’s economy in a way that has no comparison in recent history. The state’s and the nation’s economies are in the worst recession since the Great Depression of 1929 and its effects are likely to be felt for a long time. As of the writing of this post (late June 2020), after months-long mitigation efforts, Pennsylvania’s counties have begun reopening their economies. Now, a key question is, which counties are more likely to recover from the COVID-19 recession in a robust manner?
It is not easy to answer this question, because the pandemic has created unprecedent conditions and there is much uncertainty about how deeply the economies of Pennsylvania and the rest of the country have been impacted and perhaps even transformed. Also, it is not known whether the pandemic will abate in the coming months or we will face a second wave that may be more intense than the first one. These unknowns make it difficult to make predictions about the future, but some limited assessments can be made using the best available demographic, economic, and health-related indicators combined with some theoretical assumptions and models.
Which counties are more likely to recover from the COVID-19 recession in a robust manner?
For the results I discuss here, I used available data at a time when there was a relative decline in the number of daily cases in Pennsylvania. The availability of New York Times ’s county-level COVID-19 infection data made it possible to conduct these analyses.
I focused on two key variables for the analyses of COVID-19 cases: rural versus urban counties and the percentage of African-Americans in a county. There are reports that the pandemic impacted densely populated urban communities more severely initially, but the difference between the urban and rural counties has diminished over time. Is there a difference between the urban and rural counties of Pennsylvania in their rates of infection in late June 2020? It is also widely reported that the pandemic affected minority communities, particularly African-Americans more. Is that the case in Pennsylvania?
I also asked, do the findings from the analyses with these two key variables have implications for the economic recovery in the counties of Pennsylvania? To answer this question, I applied some theoretical assumptions and models on the available economic and demographic data.
Brookings researchers predict that COVID-19 will likely accelerate familiar social and economic trends. For example, the rapid automation of manufacturing and service industries will increase and in turn the people of color and those with less education, whose jobs can be automated more easily, will suffer the most. They also suggest that the dramatically increased telework practices among white-collar workers during the pandemic may accelerate the decentralization of urban areas, which may benefit rural areas, but this trend could be countered by the ongoing strong pull of the major urban areas for young and highly educated professionals. The “place-based economic development” models suggest that increased use of technology in manufacturing and service sectors in recent decades have had differential economic and health-related impacts between urban and rural communities, as well as within urban and rural communities.
Place-based economic development researchers propose models to empirically study such impacts: the vitality index , distressed communities index, and economic complexity index. I applied the vitality index, an index of overall economic strength, on Pennsylvania’s counties, with updated data. In their study of the period between 1980 and 2016, the researchers who developed the index found that the vitality index was a good predictor of future economic success of a county.
I calculated the correlations between two groups of variables (1) rate of infection with COVID-19 in a county and vitality index scores of a county and (2) population density of a county (based on the definitions of the urban versus rural counties by the Center for Rural Pennsylvania) and percentage of ethnic groups in a county. I also correlated the vitality index with the COVID-19 infection rates in counties.
With correlational analyses, I found that both rate of infection and vitality index correlate highly with population density. Additional statistical tests show that the rates of infection in urban and rural counties and their vitality index scores are significantly different. The analyses also show that as the percent of whites go up, the rate of infections and the vitality score go down. As the percent of African Americans, Latinos, and other ethnic group goes up, the rate of infections and the vitality score go down.
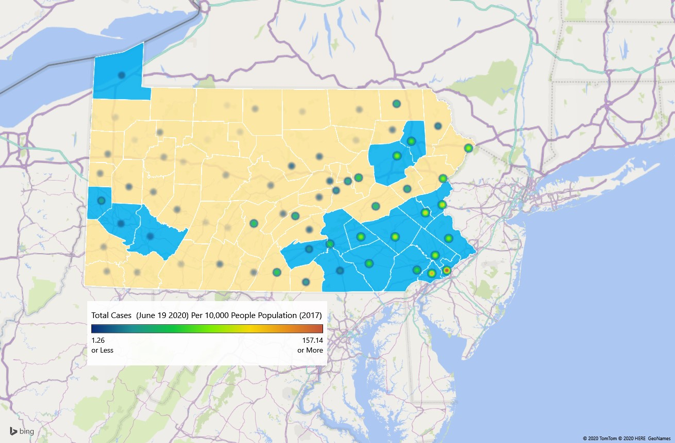
Figures 1 and 2 align with these findings and illustrate the geographic distributions of the rate of COVID-19 infections in Pennsylvania. In Figure 1, rural counties are colored yellow and urban counties blue. The colored dots show the degree of intensity of infections, from the most intense red dot to the pale green dots. The rate of infection is higher in urban counties, particularly in the southeastern quadrant of the state (including Philadelphia, Harrisburg, and Allentown) and southwest (Pittsburgh and vicinity), with some concentration in Luzern, Lackawanna, and Erie counties.
Figure 1: Rural vs. Urban Counties and Rate of Infection
In this map the percentages of African-Americans are higher in the counties with darker blue dots. Figures 1 and 2 match the well-known geographic and rural vs. urban divides, together with the ethnic disparities in the state.
Figure 2: Percent of African-Americans and Rate of Infection
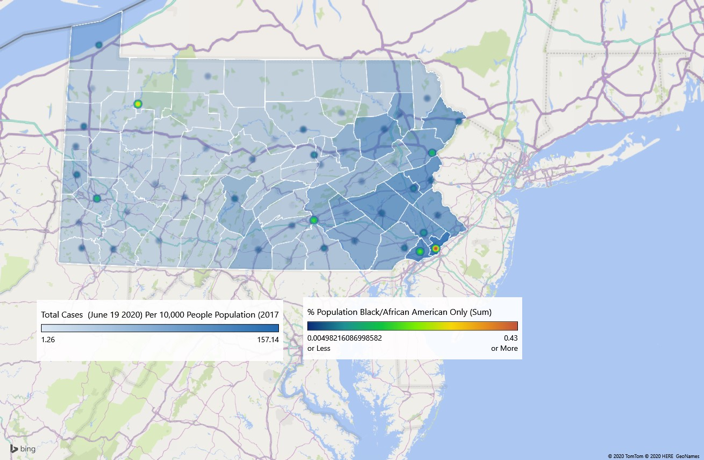
Figure 3 shows vitality index scores overlaid on the urban and rural counties. It shows that the urban counties have higher economic vitality (yellow and red dots representing higher economic vitality), compared to the rural counties.
Figure 3: Rural vs. Urban Counties and Vitality Index
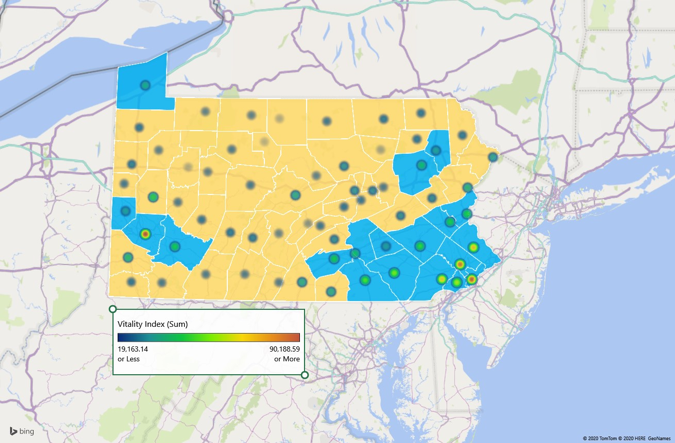
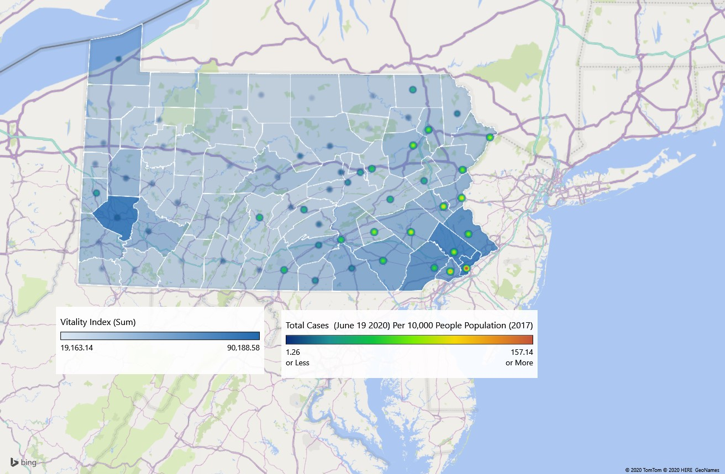
Figure 4 illustrates the high correlation between rate of infection and vitality index. It shows that the urban counties, particularly the ones in the southeast, have higher rates of infection and higher vitality index scores.
Figure 4: Rate of Infection and Vitality Index
The results and figures here conform to the nationwide patterns of COVID-19 infections: Urban counties and counties with higher percentages of African-Americans have higher rates of infections in Pennsylvania. The findings about the vitality index confirm the expectations of the place-based economic researchers: Urban counties have higher economic vitality. When these two set of findings are put together, it is possible to draw the conclusion that although the urban counties have been hit harder by the pandemic, they have a better chance to recover in the coming years because of their higher economic vitality.
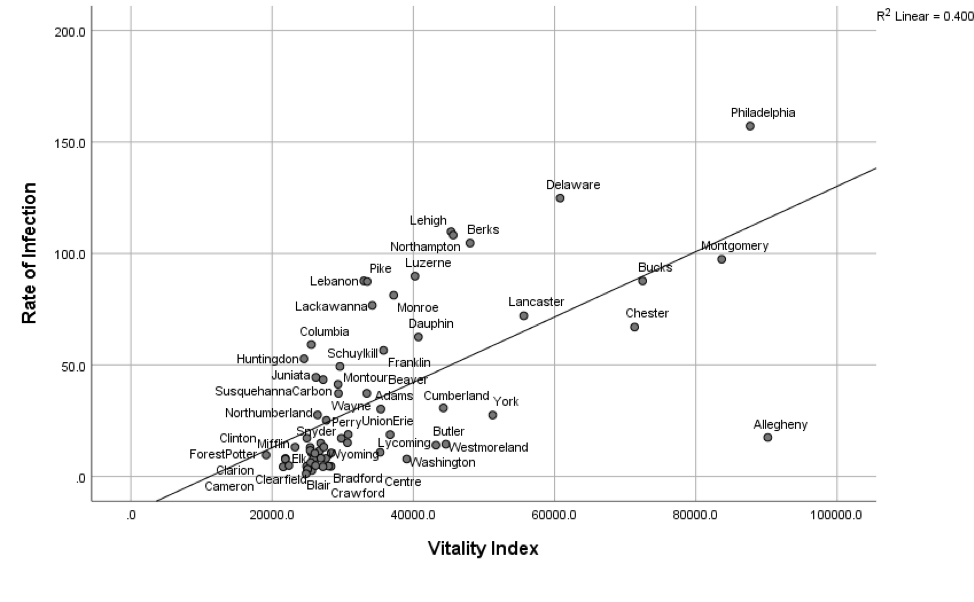
Figure 5 offers a more subtle perspective and shows the relationship between the vitality index score and rate of infection. The vitality index scores of Philadelphia and Pittsburgh (Allegheny County) are almost identical, but the rate of infections in Philadelphia is above the regression line and that of Pittsburgh is below it. With the same level of vitality, but much lower rate of infections, Pittsburgh may be better positioned for robust economic recovery in the coming years.
Figure 5: Scatterplot of Rate of infection by vitality index
Opportunities
These conclusions should be considered with some caution because we do not know the path the pandemic will take in the coming months. Also, many potentially relevant variables were not included in the analyses presented above. For example, the particular industry composition of each county should make a difference in its economic recovery because not all kinds of businesses have been affected at the same level. With the inclusion of such variables and updated data in future studies, more useful information can be generated. One conclusion can be drawn confidently, however: State- and local-level policymakers should take into account the geographic differences in their mitigation and recovery efforts. Policies should be place based.